A server's vitals in one SSH round-trip
Kitaso reads CPU, memory, disk, load and Docker stats from a Linux box in a single batched SSH command. No agent, no open port. Here is how that works.
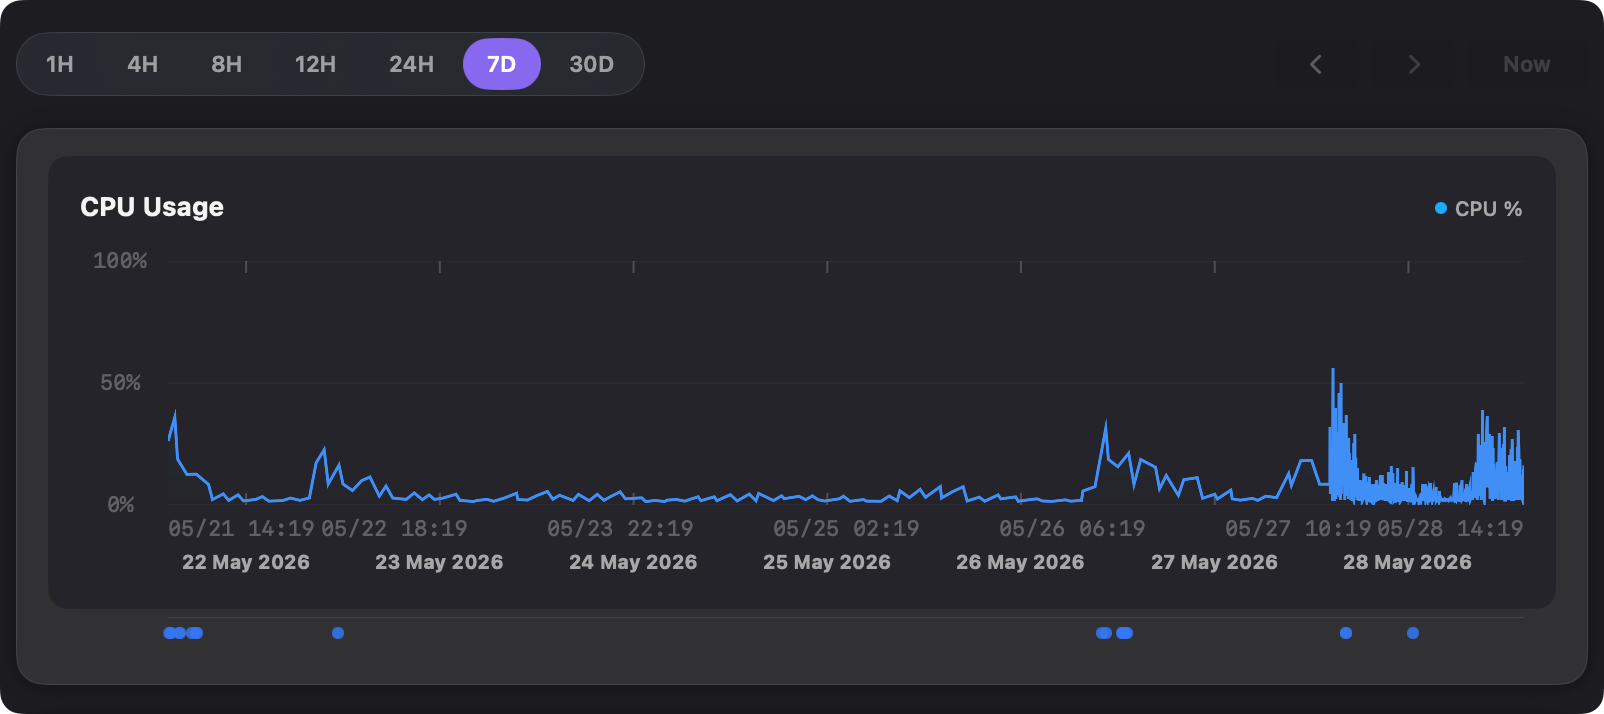
Kitaso needs to answer one question, over and over, for every server: how are you doing? Most monitoring tools answer it by installing an agent on the box. I didn't want to install anything. My Mac can already SSH into all of my servers, so why not use that?
The naive version is one SSH call per metric. One for CPU, one for memory, one for disk, one for docker stats. With four servers on a short polling interval you are suddenly opening a lot of connections, latency stacks up, and the charts start to stutter.
So Kitaso sends one batched command per poll and parses the combined output on the Mac. Roughly this:
{
  echo "===CPU==="    ; cat /proc/stat | grep '^cpu '
  echo "===MEM==="    ; cat /proc/meminfo
  echo "===LOAD==="   ; cat /proc/loadavg
  echo "===DISK==="   ; df -PB1 -x tmpfs -x devtmpfs -x overlay
  echo "===DOCKER===" ; docker stats --no-stream --format '{{json .}}' 2>/dev/null
}
One connection, one block of text. The server does almost nothing. Reading /proc is a memory copy, not a measurement. The kernel already counted everything for you; the only cost is shipping the text over SSH.
CPU is a delta, not a number
Fun detail: /proc/stat does not tell you CPU is at 40%
. It gives you cumulative counters since boot. A single reading is meaningless. You need two readings and the percentage is the ratio of busy time to total time between them:
busy  = (total₂ − idle₂) − (total₁ − idle₁)
cpu%  = busy / (total₂ − total₁) × 100
This is also why the CPU line is empty right after you add a server. There is no previous sample to diff against yet. One interval later, it starts moving.
Docker without exposing the socket
The docker stats line makes people squint. Doesn't that need the Docker socket? It does, but on the server, where the socket already lives and already belongs to the user you SSH in as. Nothing gets exposed over TCP and no port opens. Kitaso just runs docker stats in the shell it is already in and gets every container's CPU and memory, plus the image tags. When an image tag changes, that shows up as a deploy marker on the charts, so a CPU spike has a story attached.
To be fair, this is also the one line in the batch that costs the server real work. Reading /proc is free; asking the Docker daemon about every container is not. It is still one command in one connection, but the server does almost nothing
is most true on boxes without Docker.
Your keys stay yours
Kitaso does not implement SSH. It shells out to the system ssh binary, the same one you use in a terminal. That means your ~/.ssh/config, your keys, and your ssh-agent all work exactly as they already do, and servers behind a bastion work through jump hosts. The app never copies or uploads your keys; there is nothing new to trust with your credentials.
Why I care about round-trips
I monitor from a laptop, not from a box in the same datacenter. Every connection crosses the open internet, sometimes on hotel Wi-Fi. Batching means one connection per server per poll instead of five. That is the difference between charts that feel live and charts that feel like they are buffering.
It also keeps the server boring. No listener to patch, no agent to update, no new attack surface. Just ssh, /proc and df. The tools that were already there.
Want history while your Mac is off? That is the one thing Kitaso can install on a server: a tiny shell + SQLite collector on a timer.
Builds Kitaso — a native Mac app for monitoring Linux servers over SSH. More posts →