Alerts that don't cry wolf
An alert that fires on every passing spike is noise you learn to ignore. So in Kitaso, crossing a threshold starts a timer, and the metric has to outlast it.
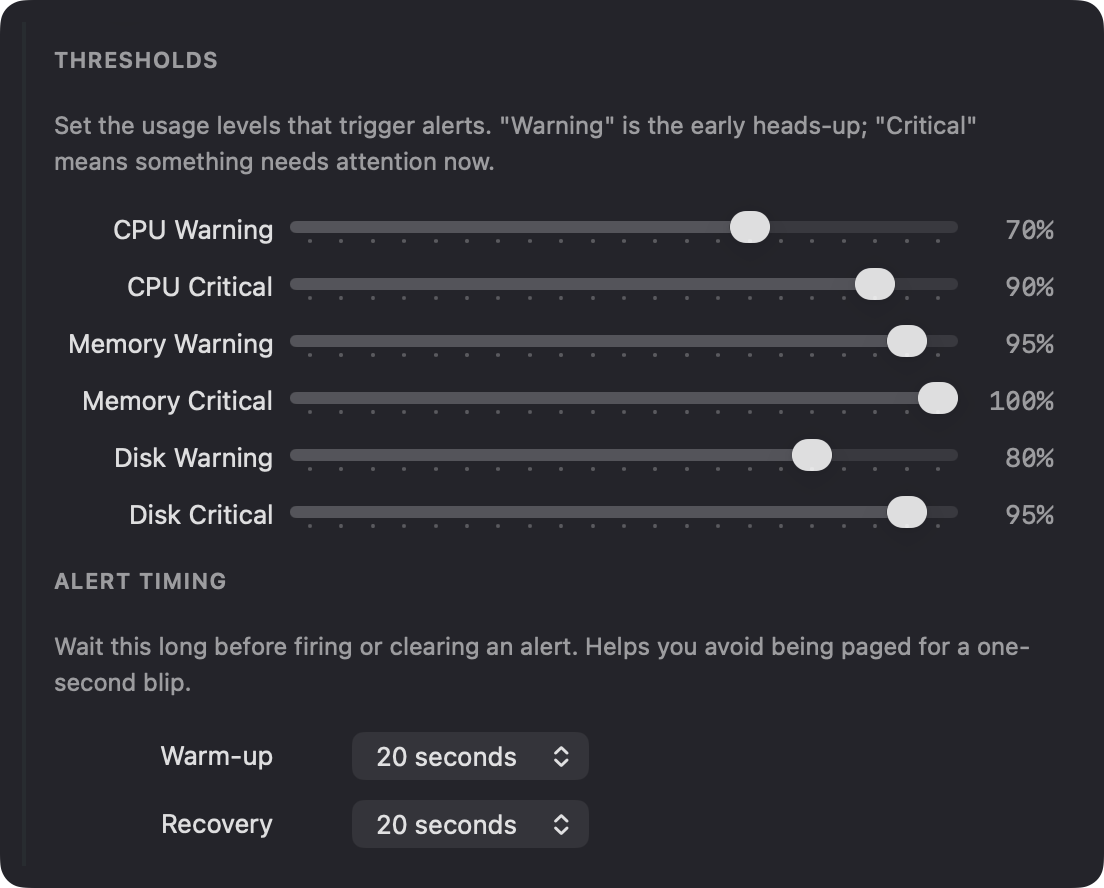
The fastest way to make me ignore alerts is to send too many. If CPU brushing 90% for four seconds during a deploy pages me, I will mute the whole thing within a week. And then the real outage arrives in silence.
So when I built alerting into Kitaso, the rule was simple: crossed a threshold
and is in trouble
are two different questions. Kitaso only bothers me about the second one.
A spike has to last
Crossing a threshold does not fire an alert. It starts a timer.
normal  ──(value > threshold)──▶  warming  ──(held for the warm-up window)──▶  alerting
   ▲                                  │
   └──────(value dips below)──────────┘   timer cancelled, nothing sent
If the value drops back under the line before the warm-up window is over, the timer is cancelled and nothing happens. The deploy spike comes and goes and you never hear about it. Only a crossing that stays crossed for the whole window becomes an alert.
Recovery has to last too
The same logic runs on the way down. One sample under the threshold doesn't mean recovered
. It might bounce right back. So Kitaso waits out a recovery window before it declares the all-clear, and a rise back above the line cancels that timer just like on the way up.
Flapping is what destroys trust in an alerting system. An alert that fires, recovers, fires, recovers, teaches you to stop reading.
Except when things get worse
There is one exception. If a metric is already alerting at the warning level and then crosses the critical threshold, that fires immediately. No new warm-up. You already waited once to confirm the problem is real. Making you wait again to learn it got worse would be silly.
It looks closer when something is up
While a metric is warming, alerting or recovering, Kitaso polls that server faster, up to your configured interval. So you get fine-grained samples through the interesting part of an incident. After ten minutes of sustained alerting it relaxes back to the normal cadence, so a long outage doesn't hammer the box.
One full disk is one alert
A server running Docker can have a dozen overlay mounts all backed by the same physical disk. A naive monitor sees twelve filesystems crossing 90% and sends twelve alerts. Kitaso deduplicates disk alerts by the underlying device. One full disk, one alert. And you can exclude specific mounts per server when you genuinely don't care about them.
And when you already know
Doing maintenance and expecting things to get loud? Snooze the server, from five minutes to until tomorrow
.
One honest limitation
Notifications fire from your Mac. If the lid is closed at 3am, nothing pages you; the server-side collector keeps the history, so the incident is on the chart in the morning, but that is a post-mortem, not an alarm. If you need something that wakes you regardless, pair Kitaso with a simple uptime pinger for the is-it-down case. Kitaso is the everything-else.
All of this is configurable per metric and per server: the thresholds, the warm-up and the recovery windows. The defaults are conservative on purpose. When Kitaso notifies me, I act on it. That is the whole point.
Curious how the readings behind these thresholds are collected? See A server's vitals in one SSH round-trip.
Builds Kitaso — a native Mac app for monitoring Linux servers over SSH. More posts →