A server to monitor a server is crazy
A server to monitor a server is crazy. Modern infrastructure design is about complicating so much that we've forgotten that our own laptop is the interface to it all. So why not monitor from there instead?
Modern infrastructure design is about complicating so much that we've forgotten that our own laptop is the interface to it all. So why not monitor from there instead?
What are you on about?
Over the years I've managed many servers, from small side projects to professionally for the companies that I've worked for.
The company servers were all managed and monitored through the infrastructure platforms that we used, but my side project servers were just there and usually it took an e-mail by a sporadic user to let me know that they were down to begin with.
Enter my own startup, Elmtrail. We run lots of servers for our AI automation platform that are all critical to stay up and running.
Our philosophy of infrastructure design is to keep it simple and easy to manage. We use Kamal to manage our services and run deploys and run everything on Hetzner that way.
For monitoring those servers, we could've setup Grafana with various datasources and whatever else. But then, who was going to monitor the Grafana server? Would I have to setup another server? Why is this such a pain? I just want to look at CPU, memory and disk usage of my servers.
Enter Kitaso
What if, I thought, I'd just SSH into my servers and get the metrics I need? What if, I thought further, I would store these collected metrics locally and display them in a simple dashboard?
That is how Kitaso was born. The first version would ping the server and display and store the metrics it fetched every minute.
Obviously, I needed a way to monitor the server when my laptop wasn't on to collect the metrics. This was easily fixed by creating a small bash script that would collect the same metrics on each server and store them in a SQLite database. My client would then fetch these metrics and display them in the dashboard.
A child can do the washing, as we say in the Netherlands.
It turns out, it is a bit more complicated than adding the word 'just' in every sentence. However, the basic premise is correct.
The result
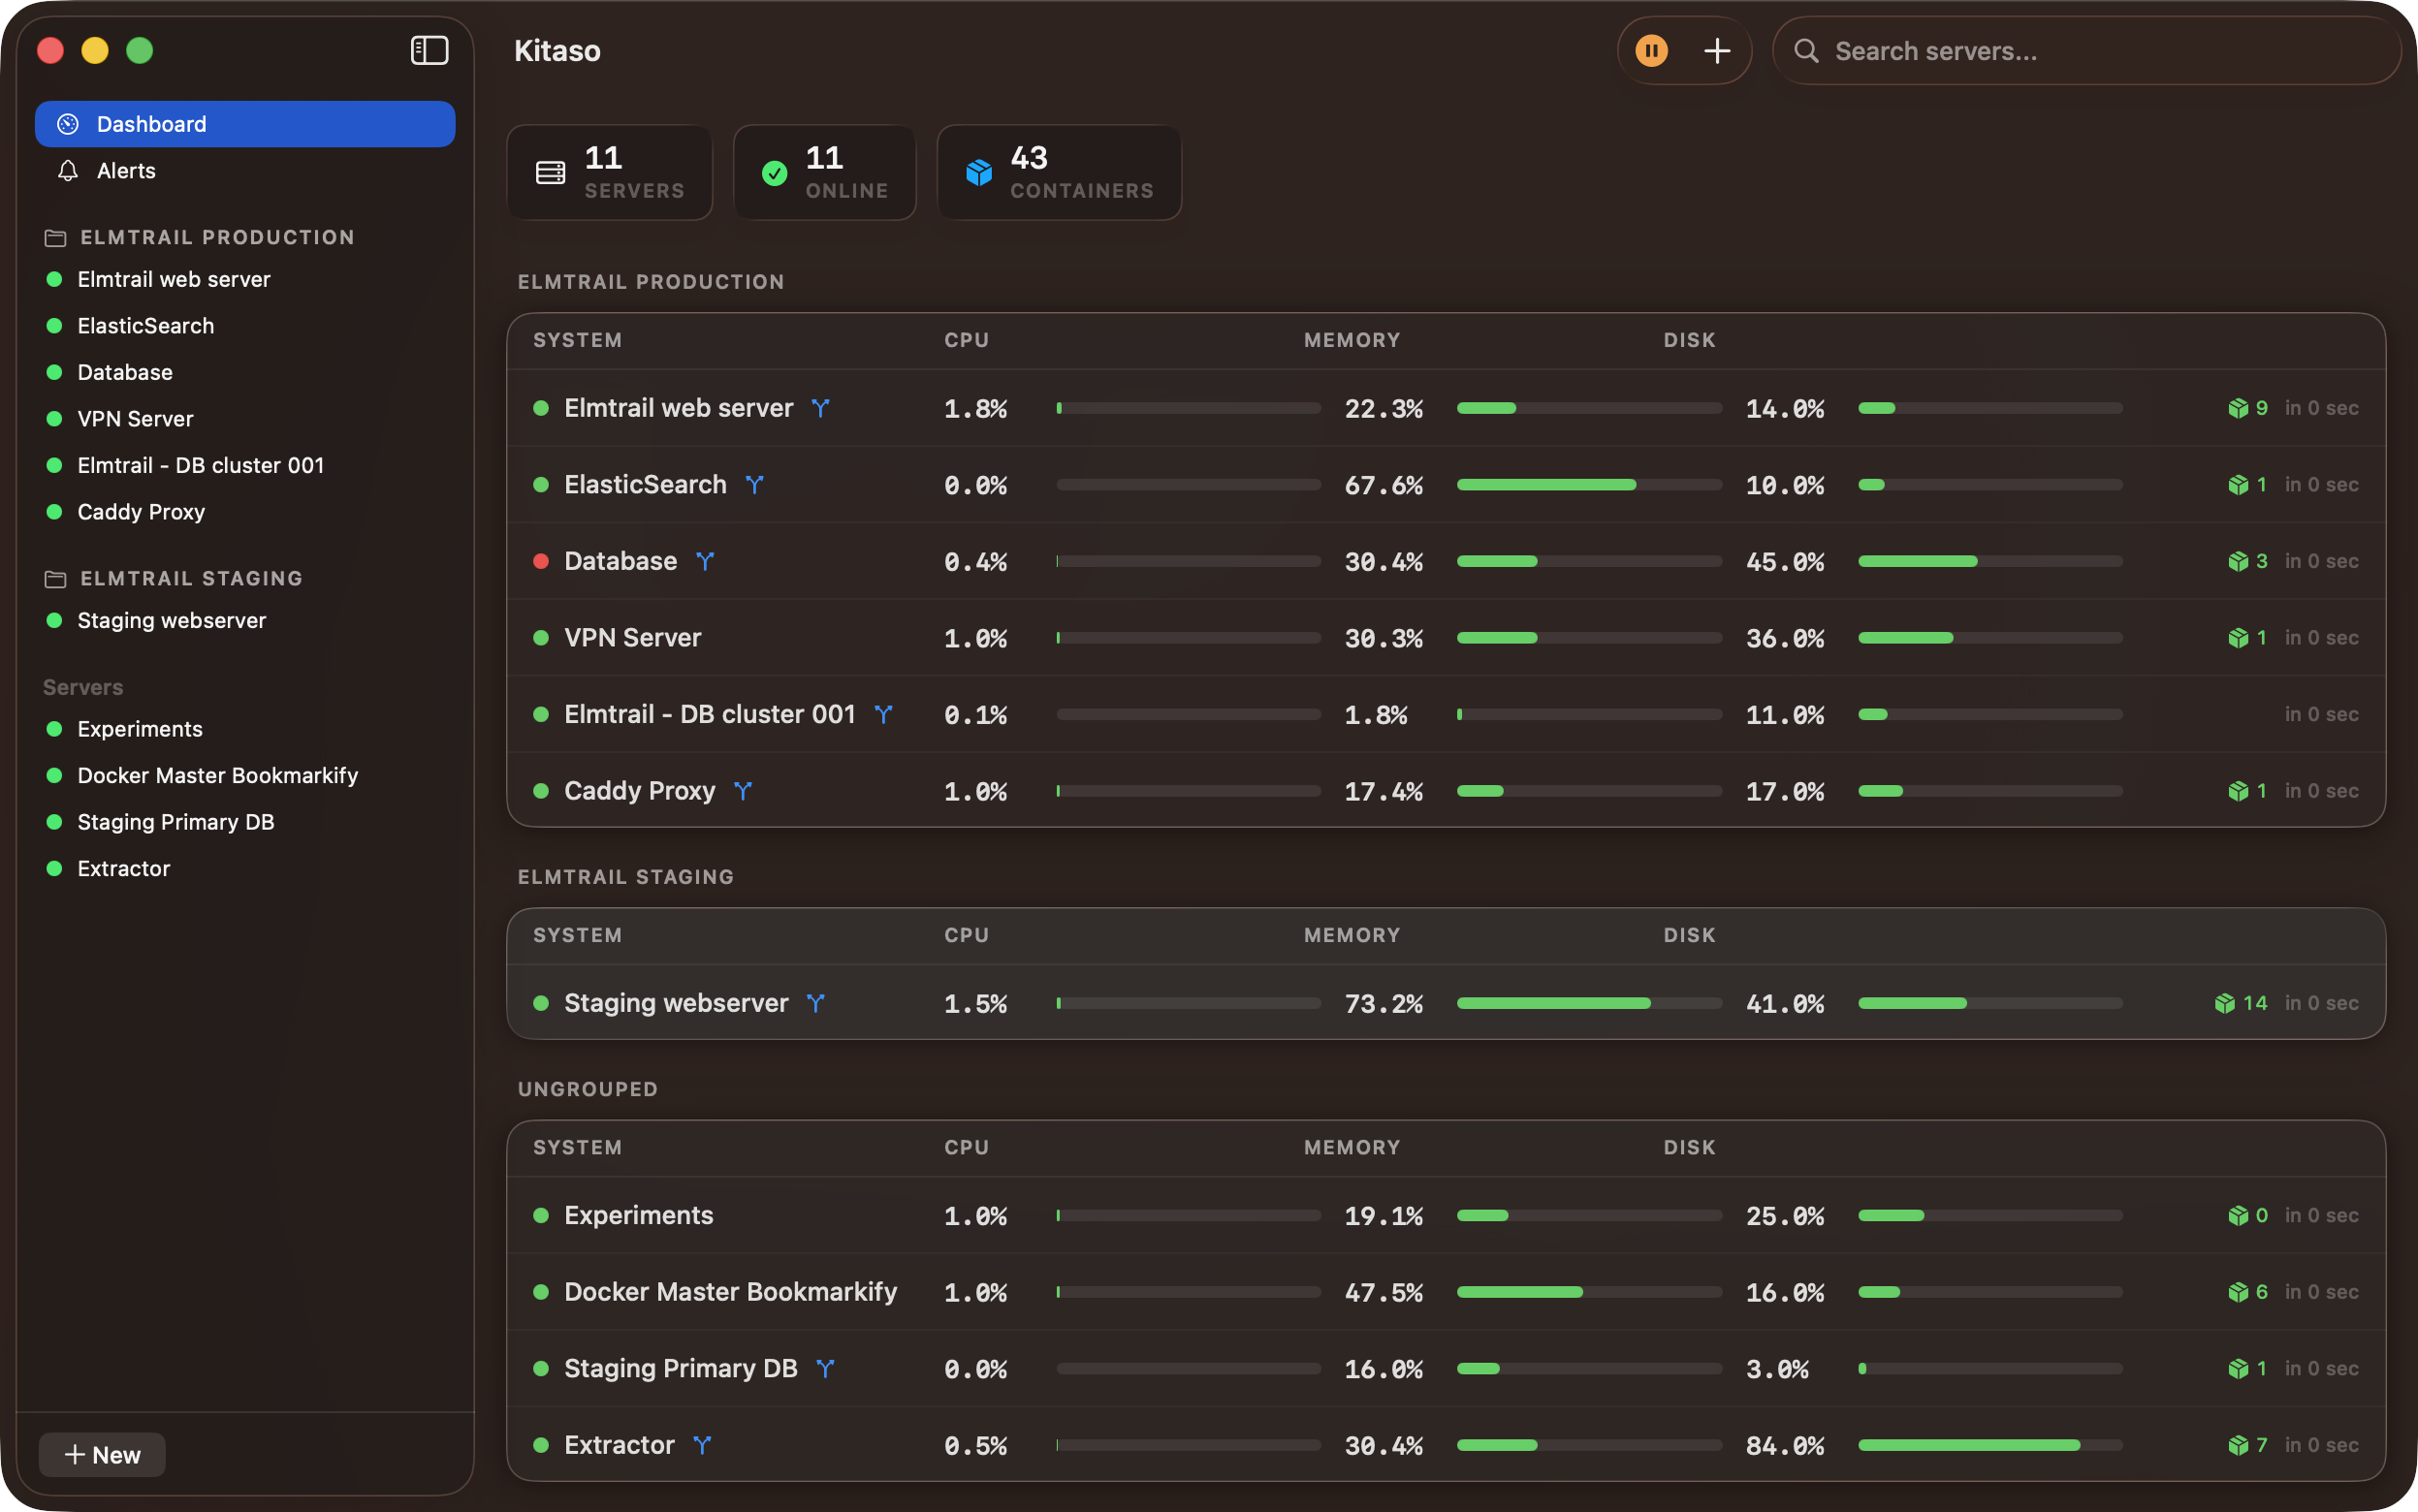
Kitaso fits the way we run infrastructure at Elmtrail: keep it simple enough that it stays out of the way, and spend the attention on the product instead.
It has alerted us early of a few issues, and it lets me look back at what a server was doing when something went wrong. I open it every day.
It does not page me at night. Notifications fire from my Mac, so a closed lid means the alert waits. The collector keeps the history, so the incident is on the chart in the morning.
Two servers are free, with no account and no time limit: kitaso.app.
Builds Kitaso — a native Mac app for monitoring Linux servers over SSH. More posts →